Published on: November 11, 2025
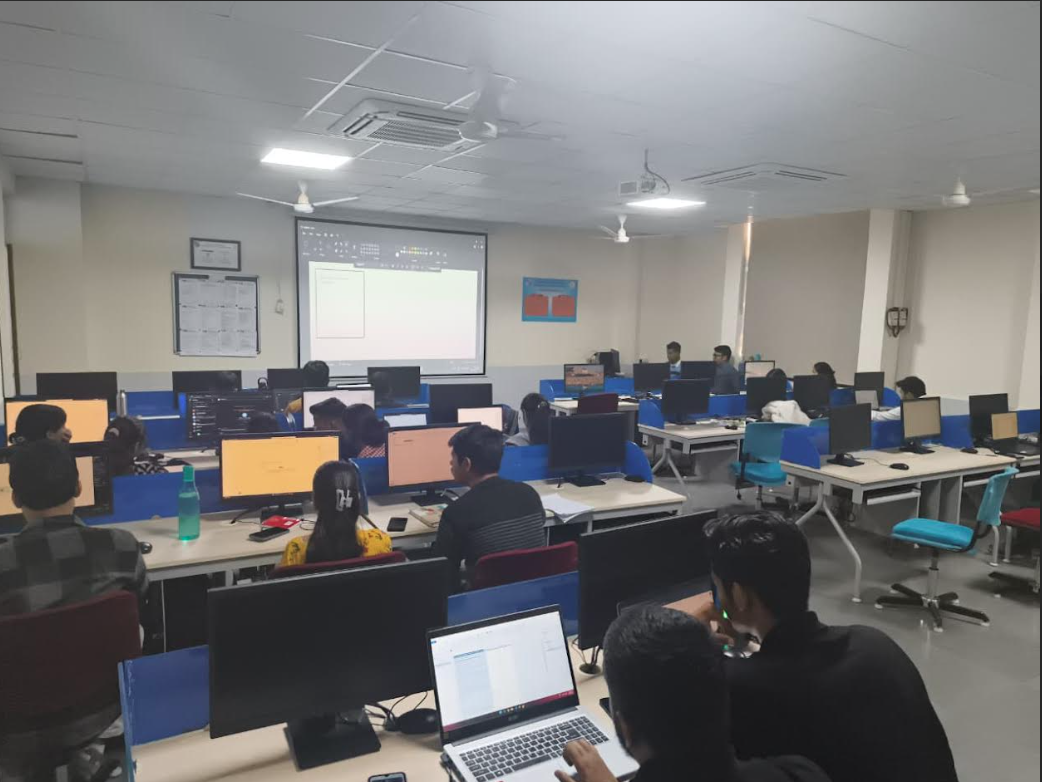
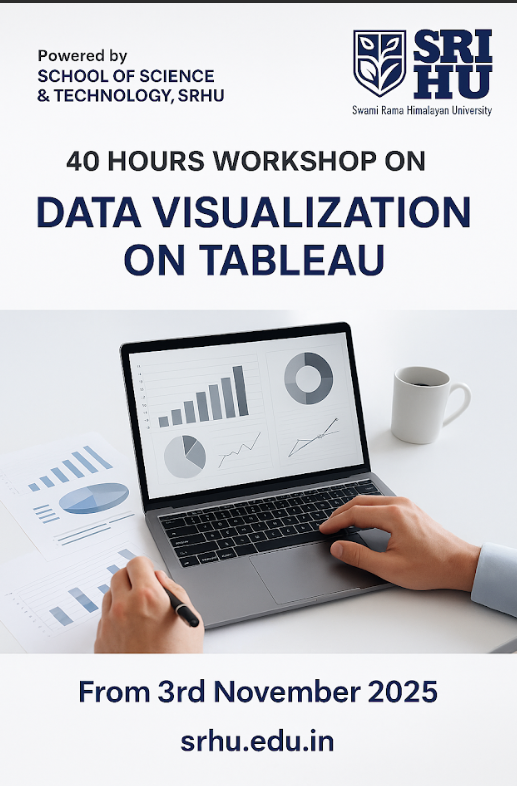
Workshop Report: Data Visualization with Tableau (SST)
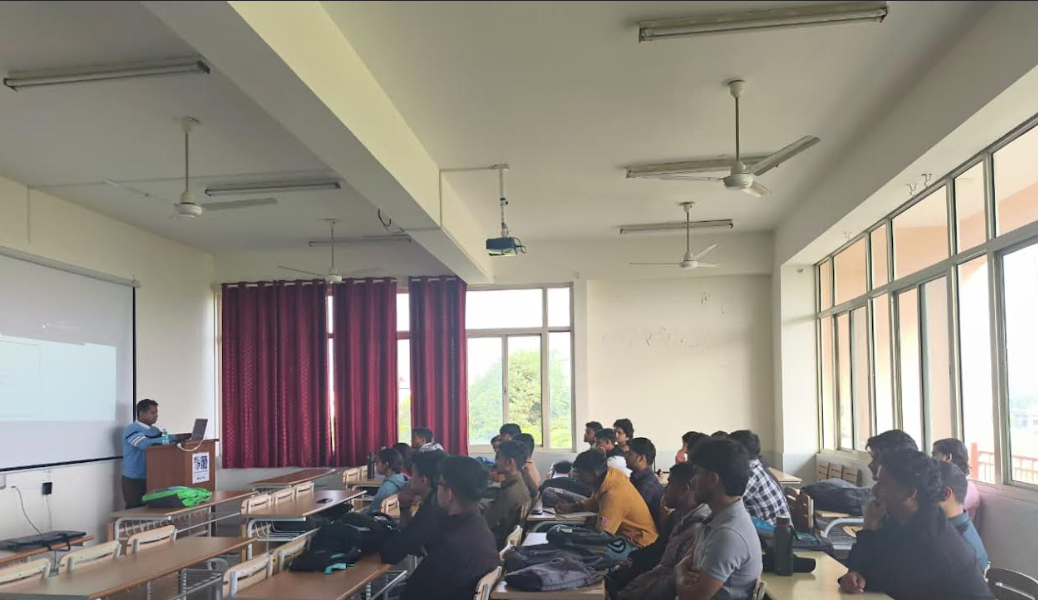
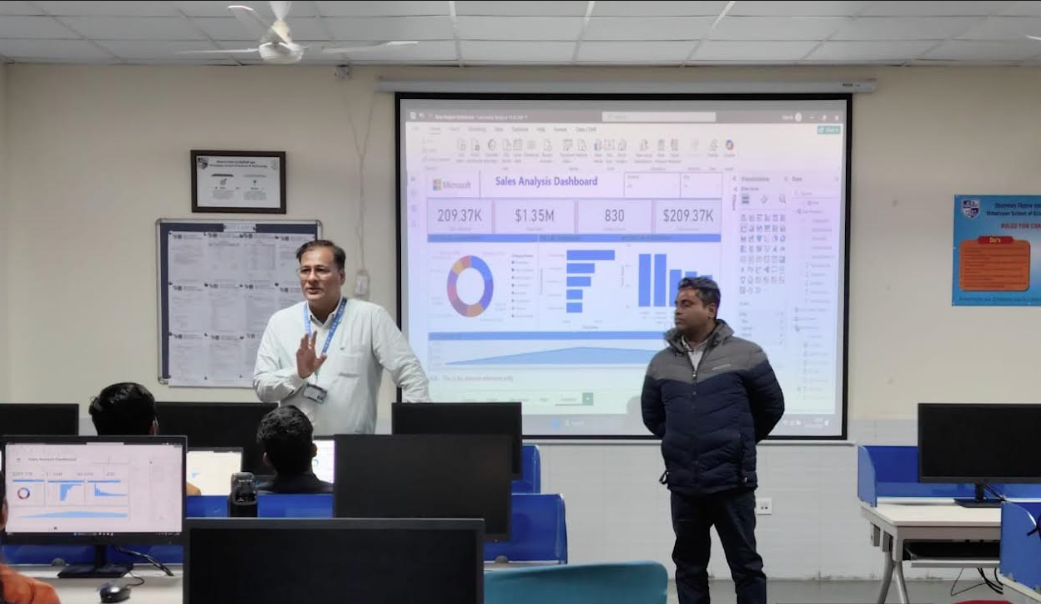
The Data Visualization with Tableau workshop, co-led by Dr. Bidhan Acharjee, Mr. Ashish Mishra, and Mr. Kaushlendra Gupta, was an engaging and insightful session that effectively combined technical expertise with practical application. Designed for participants eager to explore the world of visual analytics, the workshop provided a comprehensive foundation in Tableau—one of the leading tools in data visualization and business intelligence.
Dr. Bidhan Acharjee served as the primary presenter, guiding attendees through Tableau’s interface, data connection processes, and visualization techniques. His interactive teaching approach, supported by relatable examples, made complex concepts easy to grasp. Participants learned not only how to create diverse visualizations such as charts and dashboards, but also how to interpret data and craft meaningful, story-driven insights.
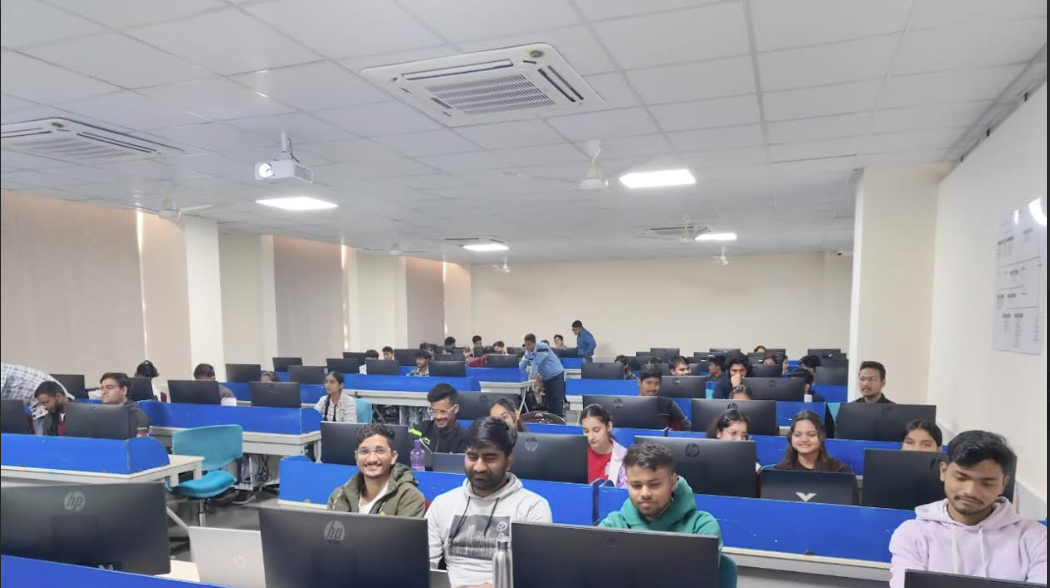
Supporting him, Mr. Kaushlendra Gupta played a key role in facilitating the hands-on component of the session. He assisted participants in real-time troubleshooting, clarified queries, and ensured that each attendee could actively engage in practical exercises. Their collaborative instruction style created a dynamic and supportive learning environment, encouraging participants to explore and experiment confidently.
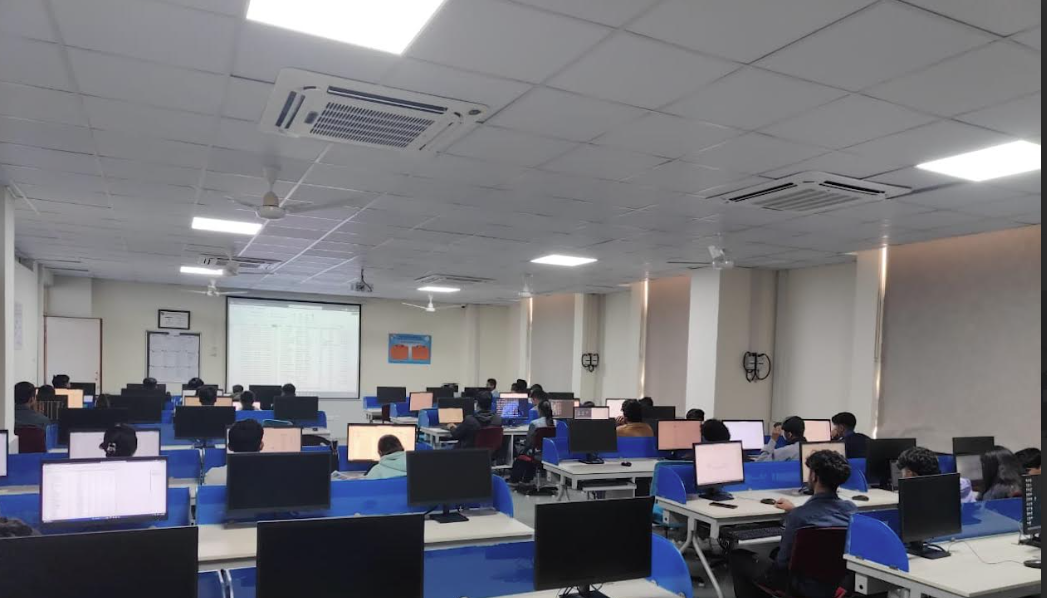
Throughout the workshop, participants gained practical experience in data preparation, transformation, and visualization design. Emphasis was placed on storytelling through data, ensuring visuals were both informative and impactful. The session’s interactive exercises and Q&A discussions kept learners deeply engaged and enthusiastic.
By the end of the workshop, participants walked away with enhanced technical proficiency in Tableau and a deeper appreciation for the art of data storytelling. The session not only empowered attendees with essential data visualization skills but also inspired them to approach data with creativity, clarity, and analytical insight.