Published on: August 31, 2024
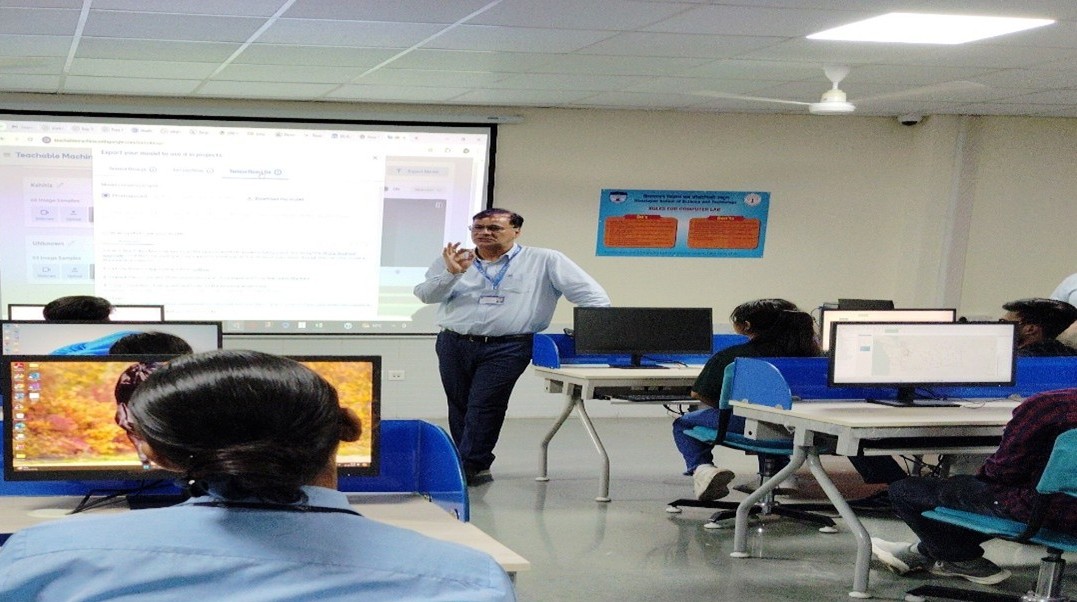
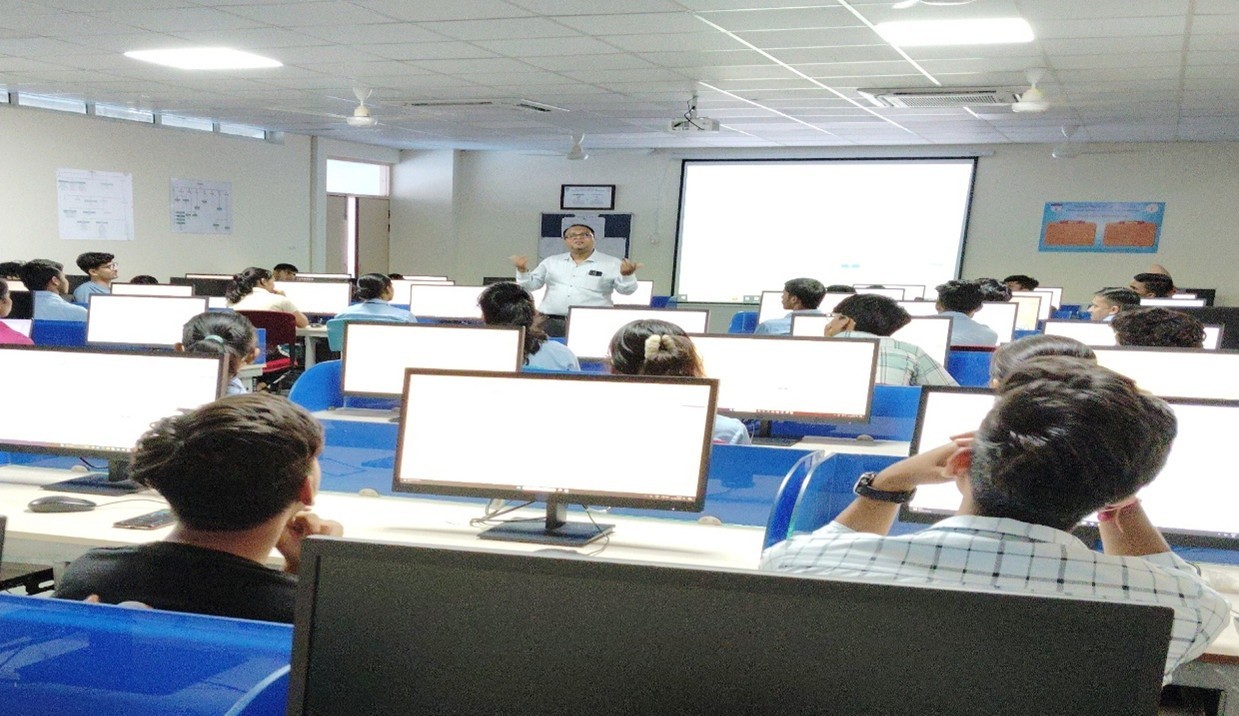
The Himalayan School of Science and Technology (HSST) organized a three-day workshop titled “Data Visualization with Tableau” from 29th to 31st August 2024. The event aimed to equip 70 students with advanced skills in data visualization, a critical component in data analysis and decision-making across various industries. During the welcome address, Prof. (Dr.) Pramod Kumar, Principal, HSST, emphasized the importance of data visualization in today’s data-driven world, highlighting how mastering tools like Tableau empowers individuals to make informed decisions. He pointed out that Tableau’s advanced capabilities in creating interactive and meaningful visualizations make it a valuable skill in the competitive job market. The resource person, Mr. Ashish Mishra, a seasoned entrepreneur and technology expert with over 17 years of experience in Artificial Intelligence, Education, IoT, Agriculture, Project Planning, Management, and Technical Support, delivered the workshop.
On the first day, Mr. Ashish Mishra introduced Tableau, focusing on its importance and utility in handling large datasets. He highlighted the limitations of traditional tools like MS Excel for complex visualizations and showcased how Tableau offers a more robust and flexible alternative. Participants were introduced to Tableau’s basic interface and began creating simple visualizations using sample datasets. The second day covered intermediate techniques, where students learned to create interactive dashboards, filter data, and use advanced chart types. The trainer demonstrated Tableau’s integration with various data sources for real-time analysis, and hands-on sessions helped participants apply these techniques to real-world scenarios. The final day focused on advanced visualization techniques and best practices in data storytelling. Students were guided in creating visually compelling dashboards suitable for business presentations, with discussions also covering ethical considerations to ensure accuracy and transparency in data visualization.
This workshop provided a significant opportunity for students to gain hands-on experience with Tableau, a tool highly valued in data science and business analytics.